


May 2014
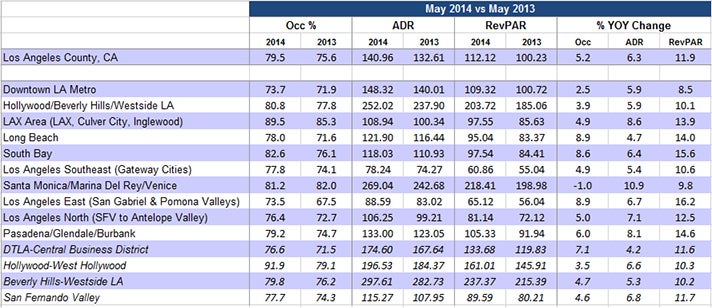
- Los Angeles ranked 5th place among the Top 25 Markets with an Occupancy rate of 79.5%, up +5.2% compared to the same period last year (75.6%).
- Los Angeles ADR was $140.96 and ranked 9th among the Top 25 Markets, up +6.3% compared to the same period last year ($132.61).
- Los Angeles RevPAR was $112.12 and ranked 8th among the Top 25 Markets, up +11.9% compared to the same period last year ($100.23).
- Rooms nights sold were 2.41 million countywide, reflecting a +6.6% increase over May 2013 (2.34 million room nights).
- The LAX area (89.5%) and South Bay (82.6%) both reported the highest Occupancy rate for the month.
- LA East (+16.2%) and South Bay (+15.6%) reported the largest YOY RevPAR growth.
2014 Jan-May YTD
- Los Angeles ranked 5th place among the Top 25 Markets with a YTD Occupancy rate of 78.3%, up +4.7% compared to the same period last year (74.8%).
o Markets ranking higher are Oahu Island (83.0%), Miami (82.9%), New York City (81.1%), and San Francisco (80.5%).
- Los Angeles YTD ADR is $142.73 and ranks 8th out of the Top 25 Markets, up +6.0% compared to the same period last year ($134.60).
- Los Angeles YTD RevPAR is $111.79 and ranks 7th out of the Top 25 Markets, up +11.0% compared to the same period last year ($100.69).
- YTD rooms nights sold are 11.5 million countywide, reflecting a +5.5% increase over 2013 (10.9 million room nights).
- The LAX area reported the highest YTD occupancy at 86.9%, followed by Hollywood/Beverly Hills (82.9%) and Santa Monica/MDR (81.6%).
- Pasadena/Glendale/Burbank (+15.1%) and LA East (+14.9%) reported the largest YOY RevPAR growth. Santa Monica reported the largest YTD ADR growth (+10.0).