


August 2014
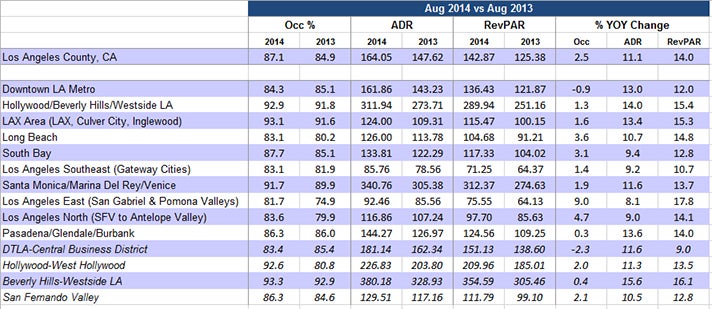
• Los Angeles ranked 6th place among the Top 25 Markets with an Occupancy rate of 87.1%, up +2.5% compared to the same period last year (84.9%).
• Los Angeles ADR was $164.05 and ranked 5th among the Top 25 Markets, up +11.1% compared to the same period last year ($147.62).
• Los Angeles RevPAR was $142.87 and ranked 6th among the Top 25 Markets, up +14.0% compared to the same period last year ($125.38).
• Rooms nights sold were 2.63 million countywide, reflecting a +3.6% increase over August 2013 (2.54 million room nights).
• The LAX area (93.1%) and Hollywood/Beverly Hills (92.9%) both reported the highest Occupancy rate for the month.
• L.A. East (+17.8%) and Hollywood/Beverly Hills (+15.4%) reported the largest YOY RevPAR growth.
2014 Jan-Aug YTD
• Los Angeles ranked 4th place among the Top 25 Markets with a YTD Occupancy rate of 81.2%, up +3.5% compared to the same period last year (78.4%).
• Markets ranking higher are Oahu Island (85.1%), San Francisco (84.5%), and New York City (84.1%),
• Los Angeles YTD ADR is $148.50 and ranks 6th out of the Top 25 Markets, up +7.5% compared to the same period last year ($138.18).
• Los Angeles YTD RevPAR is $120.53 and ranks 6th out of the Top 25 Markets, up +11.2% compared to the same period last year ($108.35).
• YTD rooms nights sold are 19.17 million countywide, reflecting a +4.2% increase over 2013 (18.40 million room nights).
• The LAX area reported the highest YTD occupancy at 89.0%, followed by Hollywood/Beverly Hills (85.0%) and Santa Monica/MDR (84.4%).
• L.A. East (+14.7%) and Pasadena/Glendale/Burbank (+13.6%) reported the largest YOY RevPAR growth. Downtown L.A. reported the largest YTD ADR growth (+10.6%).