


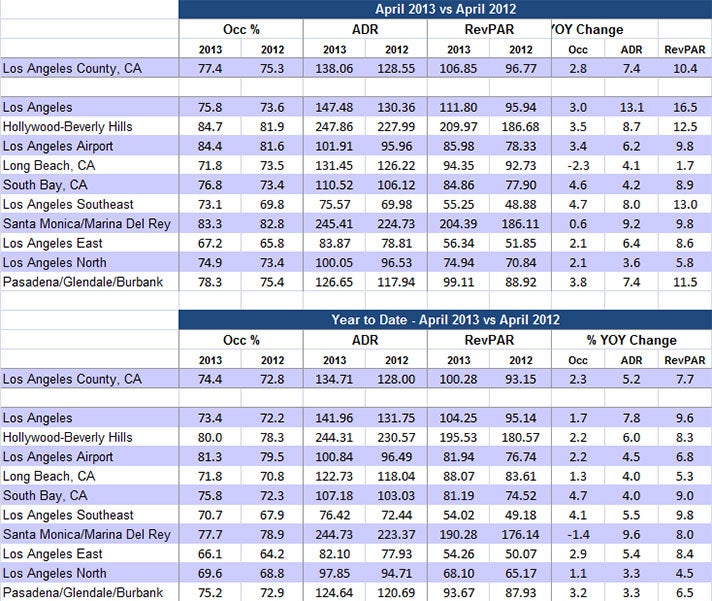
April 2013
- Los Angeles ranked 6th place among the Top 25 Markets with an Occupancy rate of 77.4%, up +2.8% compared to the same period last year (75.3%).
- Los Angeles ADR was $138.06 and ranked 8th among the Top 25 Markets, up +7.4% compared to the same period last year ($128.55).
- Los Angeles RevPAR was $106.85 and ranked 8th among the Top 25 Markets, up +10.4% compared to the same period last year ($96.77).
- • Rooms nights sold were 2.25 million countywide, reflecting a +2.8% increase over April 2012 (2.19 million room nights).
- Hollywood/Beverly Hills (84.7%) and the LAX area (84.4%) both reported the highest Occupancy rate for the month.
- Downtown LA (+16.5%) and Los Angeles Southeast (+13.0%) reported the largest YOY RevPAR growth both driven by sizeable ADR increases.
2013 Jan-Apr YTD
- Los Angeles ranked 6th place among the Top 25 Markets with a YTD Occupancy rate of 74.4%, up +2.3% compared to the same period last year (72.8%).
- Markets ranking higher are Honolulu (84.9%), Miami (84.6%), New York City (79.9%), Orlando (75.7%) and San Francisco (76.8%).
- Los Angeles YTD ADR was $134.71 and ranked 8th out of the Top 25 Markets, up +5.2% compared to the same period last year ($128.00).
- Los Angeles YTD RevPAR was $100.28 and ranked 6th out of the Top 25 Markets, up +7.7% compared to the same period last year ($93.15).
- YTD rooms nights sold were 8.65 million countywide, reflecting a +2.2% increase over 2012 (8.47 million room nights).
- The LAX area reported the highest YTD occupancy at 81.3%, followed by Hollywood/Beverly Hills (80.0%), and Santa Monica/MDR (77.7%).
- Los Angeles Southeast (+9.8%) and Downtown LA (+9.6%) reported the largest YOY RevPAR growth. South Bay reported the largest YOY growth for occupancy (+4.7%).