


October 2014
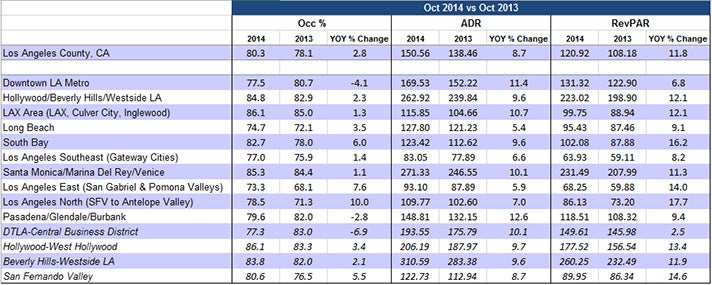
• Los Angeles ranked 6th place among the Top 25 Markets with an Occupancy rate of 80.3%, up +2.8% compared to the same period last year (78.1%).
• Los Angeles ADR was $150.56 and ranked 9th among the Top 25 Markets, up +8.7% compared to the same period last year ($138.46).
• Los Angeles RevPAR was $120.92 and ranked 6th among the Top 25 Markets, up +11.8% compared to the same period last year ($108.18).
• Rooms nights sold were 2.44 million countywide, reflecting a +4.4% increase over October 2013 (2.34 million room nights).
• The LAX area (86.1%) and Santa Monica/Marina Del Rey (85.3%) both reported the highest Occupancy rate for the month.
• LA North (+17.7%) and South Bay (+16.2%) reported the largest YOY RevPAR growth.
2014 Jan-Oct YTD
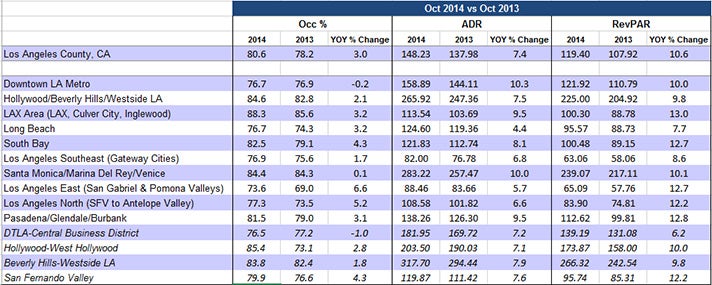
• Los Angeles ranked 4th place among the Top 25 Markets with a YTD Occupancy rate of 80.6%, up +3.0% compared to the same period last year (78.2%).
o Markets ranking higher are San Francisco (85.5%), New York City (85.1%), and Oahu Island (85.1%).
• Los Angeles YTD ADR is $148.23 and ranks 6th out of the Top 25 Markets, up +7.4% compared to the same period last year ($137.98).
• Los Angeles YTD RevPAR is $119.40 and ranks 6th out of the Top 25 Markets, up +10.6% compared to the same period last year ($107.92).
• YTD rooms nights sold are 23.84 million countywide, reflecting a +4.1% increase over 2013 (22.89 million room nights).
• The LAX area reported the highest YTD occupancy at 88.3%, followed by Hollywood/Beverly Hills (84.6%) and Santa Monica/MDR (84.4%).
• The LAX area (+13.0%) and Pasadena/Glendale/Burbank (+12.8%) reported the largest YOY RevPAR growth. Downtown LA reported the largest YTD ADR growth (+10.3).