

September 2015 Lodging Metrics
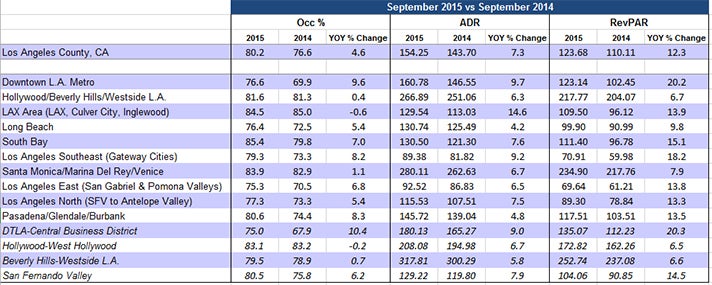
• Los Angeles ranked 7th place among the Top 25 Markets with an Occupancy rate of 80.2%, up +4.6% compared to the same period last year (76.6%).
• Los Angeles ADR was $154.25 and ranked 7th among the Top 25 Markets, up +7.3% compared to the same period last year ($143.70).
• Los Angeles RevPAR was $123.68 and ranked 6th among the Top 25 Markets, up +12.3% compared to the same period last year ($110.11).
• Rooms nights sold were 2.36 million countywide, up +4.9% over September 2014 (2.25 million room nights).
• South Bay (85.4%) and the LAX Area (84.5%) and both reported the highest Occupancy rate for the month.
2015 Jan-Sep YTD
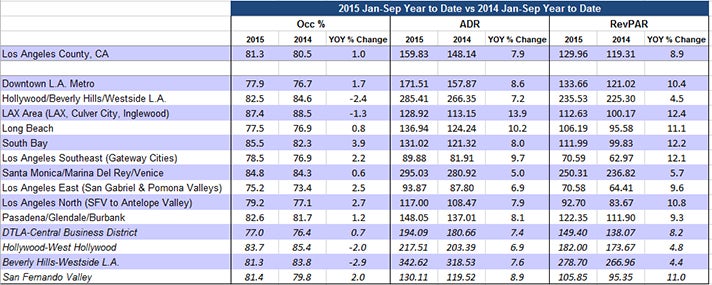
• Los Angeles ranked 4th place among the Top 25 Markets with a YTD Occupancy rate of 81.3%, up +1.0% compared to the same period last year (80.5%).
o Markets ranking higher are San Francisco (85.6%), Oahu Island (85.2%), and New York (84.3%).
• Los Angeles YTD ADR is $159.83 and ranks 6th out of the Top 25 Markets, up +7.9% compared to the same period last year ($148.14).
• Los Angeles YTD RevPAR is $129.96 and ranks 6th out of the Top 25 Markets, up +8.9% compared to the same period last year ($119.31).
• YTD rooms nights sold are 21.76 million countywide, reflecting a +1.7% increase over 2014 (21.40 million room nights).
• The LAX area reported the highest YTD occupancy at 87.4%, followed by South Bay (85.5%).