

October 2013
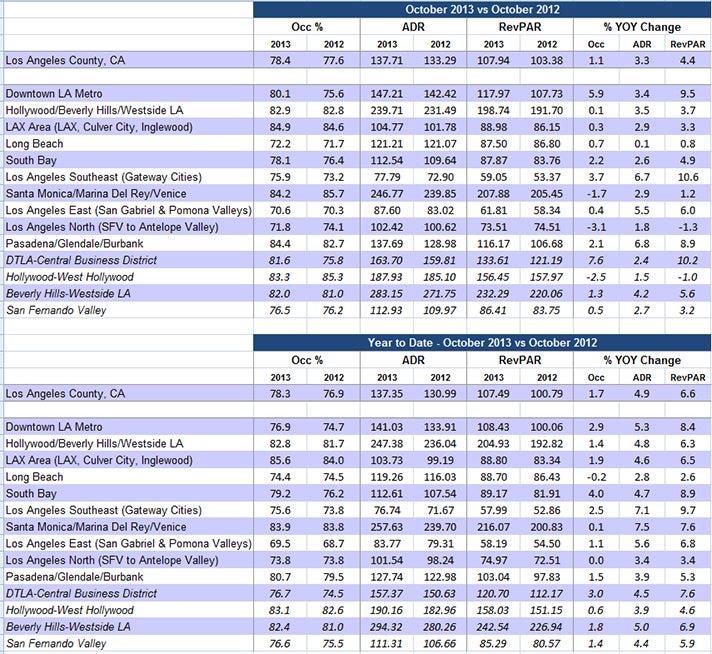
- Los Angeles ranked 5th place among the Top 25 Markets with an Occupancy rate of 78.4%, up +1.1% compared to the same period last year (77.6%).
- Los Angeles ADR was $137.71 and ranked 5th among the Top 25 Markets, up +3.3% compared to the same period last year ($133.29).
- Los Angeles RevPAR was $107.94 and ranked 8th among the Top 25 Markets, up +4.4% compared to the same period last year ($103.38).
- Rooms nights sold were 2.35 million countywide, reflecting a +1.7% increase over October 2012 (2.31 million room nights).
• The LAX area (84.9%) and Santa Monica/Marina Del Rey (84.2%) both reported the highest Occupancy rate for the month.
• Los Angeles Southeast (+10.6%) and Pasadena/Glendale/Burbank (+9.4%) reported the largest YOY RevPAR growth both driven by sizeable ADR increases.
2013 Jan-Oct YTD
- Los Angeles remained at 4th place among the Top 25 Markets with a YTD Occupancy rate of 78.3%, up +1.7% compared to the same period last year (76.9%).
- Markets ranking higher are New York City (84.8%), Oahu Island (84.7%), and San Francisco (84.5%).
- Los Angeles YTD ADR is $137.35 and ranks 9th out of the Top 25 Markets, up +4.9% compared to the same period last year ($130.99).
- Los Angeles YTD RevPAR is $107.49 and ranks 6th out of the Top 25 Markets, up +6.6% compared to the same period last year ($100.79).
- YTD rooms nights sold are 23.08 million countywide, reflecting a +1.9% increase over 2012 (22.64 million room nights).
- The LAX area reported the highest YTD occupancy at 85.6%, followed by Santa Monica/MDR (83.9%) and Hollywood/Beverly Hills (82.8%).
- Los Angeles Southeast (+9.7%) and South Bay (+8.9%) reported the largest YOY RevPAR growth. Santa Monica reported the largest YTD ADR growth (+7.5).