


Los Angeles ranked 8th place among the Top 25 Markets with an Occupancy rate of 84.0%, up +1.1% compared to the same period last year (83.1%).
June 2015
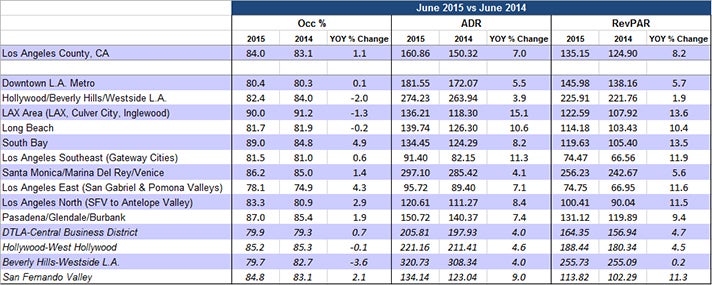
- Los Angeles ranked 8th place among the Top 25 Markets with an Occupancy rate of 84.0%, up +1.1% compared to the same period last year (83.1%).
- Los Angeles ADR was $160.86 and ranked 6th among the Top 25 Markets, up +7.0% compared to the same period last year ($150.32).
- Los Angeles RevPAR was $135.15 and ranked 6th among the Top 25 Markets, up +8.2% compared to the same period last year ($124.90).
- Rooms nights sold were 2.46 million countywide, up +1.0% over June 2014 (2.43 million room nights).
- The LAX area (90.0%) and South Bay (89.0%) both reported the highest Occupancy rate for the month.
2015 Jan-Jun YTD
- Los Angeles ranked 6th place among the Top 25 Markets with a YTD Occupancy rate of 79.6%, up +0.7% compared to the same period last year (79.0%).
- Markets ranking higher are Oahu Island (83.9%), San Francisco (83.1%), New York (82.2%), Miami (80.8%), and Orlando (80.1%).
- Los Angeles YTD ADR is $154.39 and ranks 8th out of the Top 25 Markets, up +6.8% compared to the same period last year ($144.54).
- Los Angeles YTD RevPAR is $122.83 and ranks 6th out of the Top 25 Markets, up +7.6% compared to the same period last year ($114.16).
- YTD rooms nights sold are 14.05 million countywide, reflecting a +1.2% increase over 2014 (13.88 million room nights).
- The LAX area reported the highest YTD occupancy at 87.0%, followed by South Bay (83.9%).