

JUNE 2013
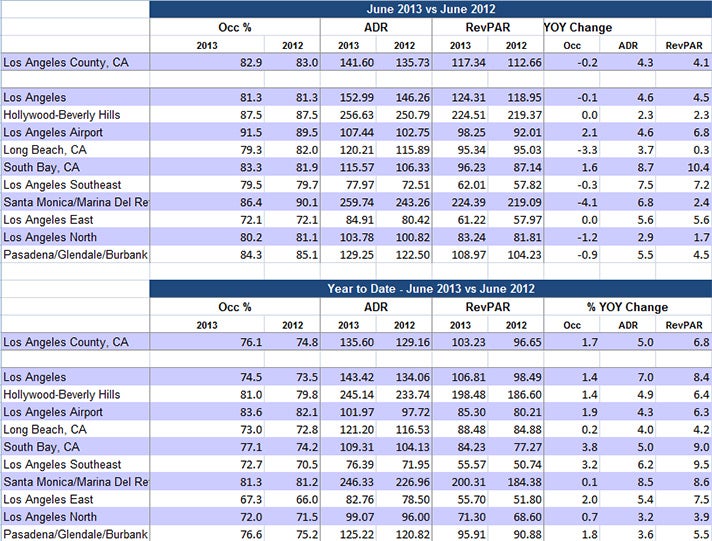
- Los Angeles ranked 8th place among the Top 25 Markets with an Occupancy rate of 82.9%, down -0.2% compared to the same period last year (83.0%).
- Los Angeles ADR was $141.60 and ranked 7th among the Top 25 Markets, up +4.3% compared to the same period last year ($135.73).
- Los Angeles RevPAR was $117.34 and ranked 6th among the Top 25 Markets, up +4.1% compared to the same period last year ($112.66).
- Rooms nights sold were 2.42 million countywide, reflecting a +0.1% increase over June 2012 (2.41 million room nights).
- The LAX area (91.5%) and Hollywood/Beverly Hills (87.5%) reported the highest Occupancy rate for the month.
- South Bay (+10.4%) and Los Angeles Southeast (+7.2%) reported the largest YOY RevPAR growth both driven by sizeable ADR increases.
2013 JAN-JUN YTD
- Los Angeles is maintaining 5th place among the Top 25 Markets with a YTD Occupancy rate of 76.1%, up +1.7% compared to the same period last year (74.8%).
- - Markets ranking higher are Honolulu (84.1%), New York City (82.5%), Miami (81.1%) and San Francisco (80.4%)
- Los Angeles YTD ADR is $135.60 and ranks 8th out of the Top 25 Markets, up +5.0% compared to the same period last year ($129.16).
- Los Angeles YTD RevPAR is $103.23 and ranks 7th out of the Top 25 Markets, up +6.8% compared to the same period last year ($96.65).
- YTD rooms nights sold are 13.36 million countywide, reflecting a +1.7% increase over 2012 (13.13 million room nights).
- The LAX area reported the highest YTD occupancy at 83.6%, followed by Santa Monica/MDR (81.3%) and Hollywood/Beverly Hills (81.0%).
- Los Angeles Southeast (+9.5%) and South Bay (+9.0%) reported the largest YOY RevPAR growth. Santa Monica reported the largest YTD ADR growth (+8.5%).