

July 2016
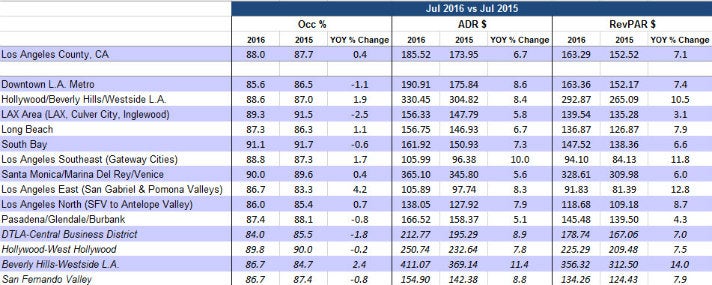
• Los Angeles ranked 5th place among the Top 25 Markets with an Occupancy rate of 88.0%, up +0.4% compared to the same period last year (87.7%).
• Los Angeles ADR was $185.52 and ranked 6th among the Top 25 Markets, up +6.7% compared to the same period last year ($173.95).
• Los Angeles RevPAR was $163.29 and ranked 6th among the Top 25 Markets, up +7.1% compared to the same period last year ($152.52).
• Rooms nights sold were 2.67 million countywide, up +0.1% over July 2015 (2.67 million room nights).
• South Bay (91.1%) and Santa Monica/Marina Del Rey/Venice (90.0%) both reported the highest Occupancy rate for the month.
2016 Jan-July YTD
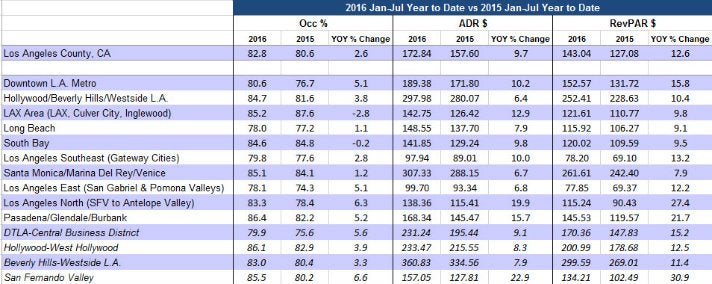
• Los Angeles ranked 4th place among the Top 25 Markets with a YTD Occupancy rate of 82.8%, up +2.6% compared to the same period last year (80.6%).
o Markets ranking higher are Oahu Island (84.6%), San Francisco (84.5%), and New York City (83.8%)
• Los Angeles YTD ADR is $172.84 and ranks 6th out of the Top 25 Markets, up +9.7% compared to the same period last year ($157.60).
• Los Angeles YTD RevPAR is $143.04 and ranks 5th out of the Top 25 Markets, up +12.6% compared to the same period last year ($127.08).
• YTD rooms nights sold are 17.19 million countywide, reflecting a +2.5% increase over 2015 (16.77 million room nights).
• Pasadena/Glendale/Burbank reported the highest YTD occupancy at 86.4%, followed by Hollywood/West Hollywood (86.1%).