


February 2016

• Los Angeles ranked 3rd place among the Top 25 Markets with an Occupancy rate of 83.5%, up +4.2% compared to the same period last year (80.1%).
• Los Angeles ADR was $175.29 and ranked 5th among the Top 25 Markets, up +12.9% compared to the same period last year ($155.21).
• Los Angeles RevPAR was $146.34 and ranked 4th among the Top 25 Markets, up +17.7% compared to the same period last year ($124.34).
• Rooms nights sold were 2.30 million countywide, up +4.4% over February 2015 (2.20 million room nights).
• Pasadena/Glendale/Burbank (89.8%) and Hollywood/West Hollywood (88.6%) both reported the highest Occupancy rate for the month.
2016 Jan-Feb YTD
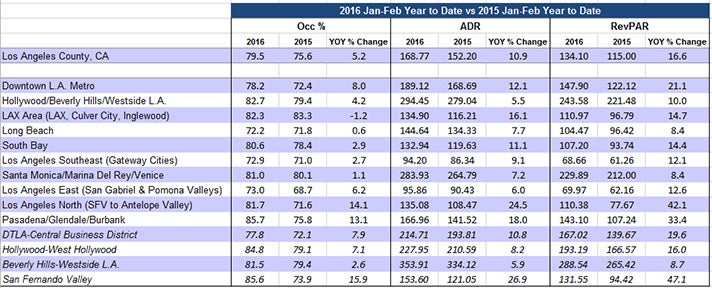
• Los Angeles ranked 3rd place among the Top 25 Markets with a YTD Occupancy rate of 79.5%, up +5.2% compared to the same period last year (75.6%).
o Markets ranking higher are Oahu Island (85.4%) and Miami (82.4%).
• Los Angeles YTD ADR is $168.77 and ranks 5th out of the Top 25 Markets, up +10.9% compared to the same period last year ($152.20).
• Los Angeles YTD RevPAR is $134.10 and ranks 5th out of the Top 25 Markets, up +16.6% compared to the same period last year ($115.00).
• YTD rooms nights sold are 4.61 million countywide, reflecting a +5.2% increase over 2015 (4.38 million room nights).
• Pasadena/Glendale/Burbank reported the highest YTD occupancy at 85.7%, followed by Hollywood/West Hollywood (84.8%).