

August 2016
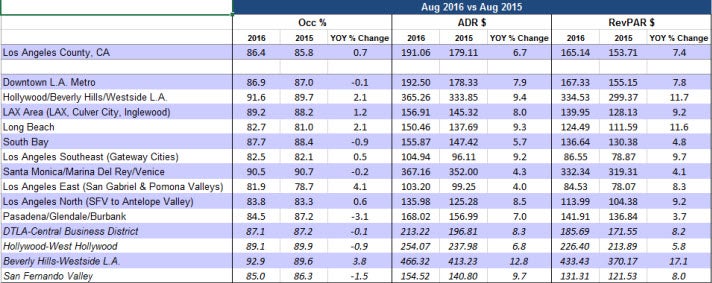
• Los Angeles ranked 5th place among the Top 25 Markets with an Occupancy rate of 86.4%, up +0.7% compared to the same period last year (85.8%).
• Los Angeles ADR was $191.06 and ranked 5th among the Top 25 Markets, up +6.7% compared to the same period last year ($179.11).
• Los Angeles RevPAR was $165.14 and ranked 5th among the Top 25 Markets, up +7.4% compared to the same period last year ($153.71).
• Rooms nights sold were 2.63 million countywide, up +0.4% over August 2015 (2.62 million room nights).
• Hollywood/Beverly Hills (91.6%) and Santa Monica/Marina Del Rey/Venice (90.5%) both reported the highest Occupancy rate for the month.
2016 Jan-Aug YTD
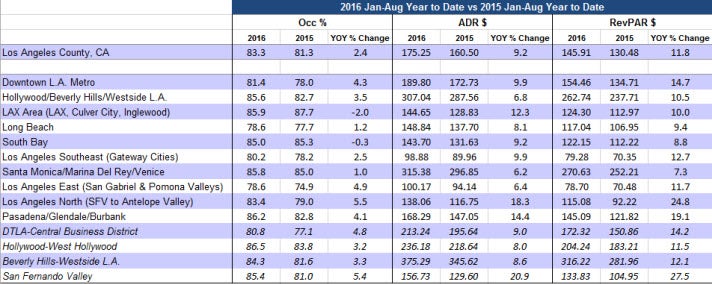
• Los Angeles ranked 4th place among the Top 25 Markets with a YTD Occupancy rate of 83.3%, up +2.4% compared to the same period last year (81.3%).
- Markets ranking higher are San Francisco (85.1%), Oahu Island (84.9%), and New York City (84.4%)
• Los Angeles YTD ADR is $175.25 and ranks 6th out of the Top 25 Markets, up +9.2% compared to the same period last year ($160.50).
• Los Angeles YTD RevPAR is $145.91 and ranks 5th out of the Top 25 Markets, up +11.8% compared to the same period last year ($130.48).
• YTD rooms nights sold are 19.82 million countywide, reflecting a +2.2% increase over 2015 (19.39 million room nights).
• Pasadena/Glendale/Burbank reported the highest YTD occupancy at 86.2%, followed by the LAX Area (85.9%).