
August 2013
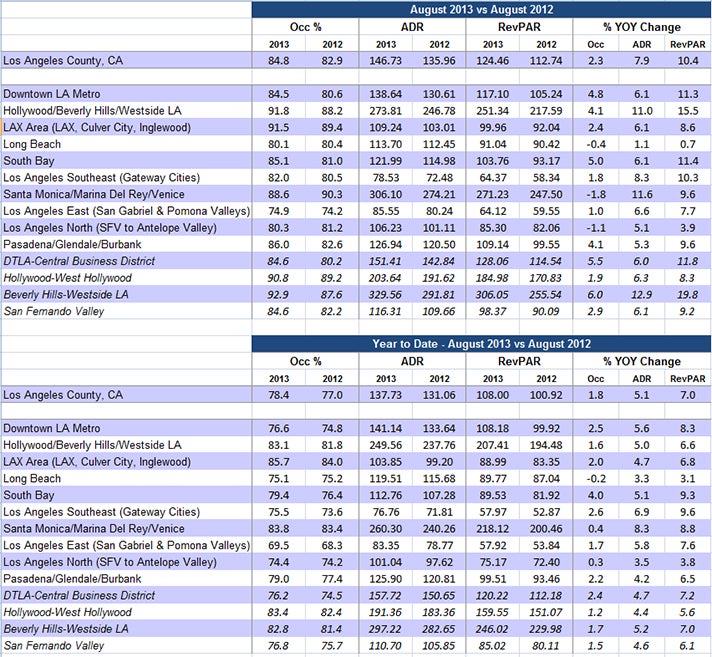
- Los Angeles ranked 6th place among the Top 25 Markets with an Occupancy rate of 84.8%, up +2.3% compared to the same period last year (82.9%).
- Los Angeles ADR was $146.73 and ranked 6th among the Top 25 Markets, up +7.9% compared to the same period last year ($135.96).
- Los Angeles RevPAR was $124.46 and ranked 7th among the Top 25 Markets, up +10.4% compared to the same period last year ($112.74).
- Rooms nights sold were 2.56 million countywide, reflecting a +2.9% increase over August 2012 (2.48 million room nights).
- Hollywood/Beverly Hills (91.8%) and the LAX area (91.5%) both reported the highest Occupancy rate for the month.
- Hollywood/Beverly Hills (+15.5%) and South Bay (+11.4%) reported the largest YOY RevPAR growth both driven by sizeable ADR increases.
2013 Jan-Aug YTD
- Los Angeles is maintaining 5th place among the Top 25 Markets with a YTD Occupancy rate of 78.4%, up +1.8% compared to the same period last year (77.0%). Markets ranking higher are Oahu Island (85.2%), New York City (83.8%), San Francisco (83.1%) and Miami (79.6%).
- Los Angeles YTD ADR is $137.73 and ranks 8th out of the Top 25 Markets, up +5.1% compared to the same period last year ($131.06).
- Los Angeles YTD RevPAR is $108.00 and ranks 6th out of the Top 25 Markets, up +7.0% compared to the same period last year ($100.92).
- YTD rooms nights sold are 18.48 million countywide, reflecting a +2.0% increase over 2012 (18.13 million room nights).
- The LAX area reported the highest YTD occupancy at 85.7%, followed by Santa Monica/MDR (83.8%) and Hollywood/Beverly Hills (83.1%).
- Los Angeles Southeast (+9.6%) and South Bay (+9.3%) reported the largest YOY RevPAR growth. Santa Monica reported the largest YTD ADR growth (+8.3%).