


April 2016

• Los Angeles ranked 3rd place among the Top 25 Markets with an Occupancy rate of 83.2%, up +4.7% compared to the same period last year (79.5%).
• Los Angeles ADR was $173.50 and ranked 7th among the Top 25 Markets, up +11.6% compared to the same period last year ($155.48).
• Los Angeles RevPAR was $144.39 and ranked 6th among the Top 25 Markets, up +16.9% compared to the same period last year ($123.54).
• Rooms nights sold were 2.44 million countywide, up +4.6% over April 2015 (2.34 million room nights).
• Pasadena/Glendale/Burbank (88.9%) and Santa Monica/Marina Del Rey (87.1%) both reported the highest Occupancy rate for the month.
2016 Jan-Apr YTD
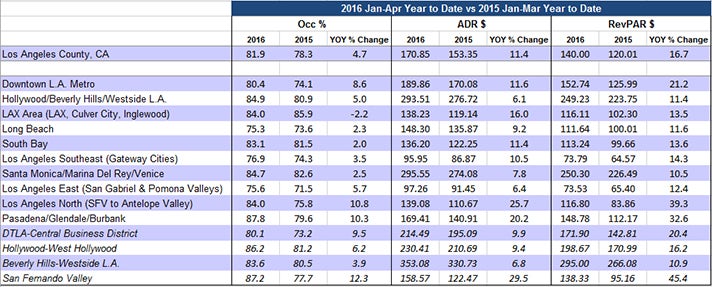
• Los Angeles ranked 3rd place among the Top 25 Markets with a YTD Occupancy rate of 81.9%, up +4.7% compared to the same period last year (78.3%).
o Markets ranking higher are Oahu Island (83.6%) and Miami (82.5%).
• Los Angeles YTD ADR is $170.85 and ranks 5th out of the Top 25 Markets, up +11.4% compared to the same period last year ($153.35).
• Los Angeles YTD RevPAR is $140.00 and ranks 5th out of the Top 25 Markets, up +16.7% compared to the same period last year ($120.01).
• YTD rooms nights sold are 9.64 million countywide, reflecting a +4.6% increase over 2015 (9.22 million room nights).
• Pasadena/Glendale/Burbank reported the highest YTD occupancy at 87.8%, followed by Santa Monica/Marina Del Rey (84.7%).